If there is a data point on your AF Neighborhood Guide page you'd like to further customize, you can manually override that.
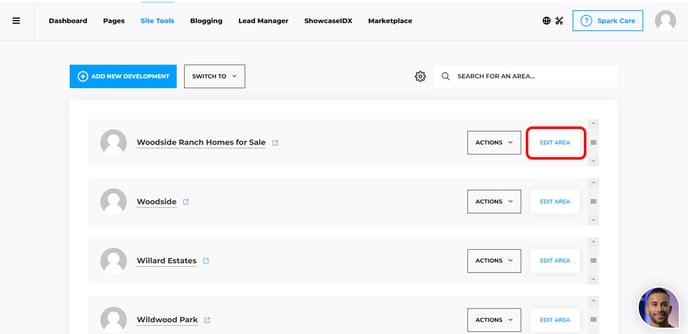
Start by navigating to the area you want to modify, and click on the Edit button.
There are 2 sections where you can customize the data:
-
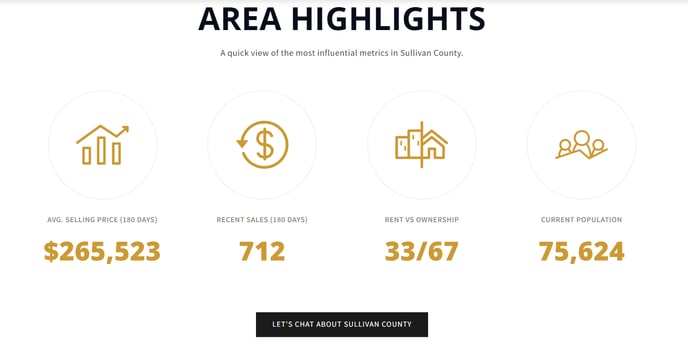
Discover Section - Area Highlights
-
Area Data Section - Demographic Information
Note: these sections are named like this by default

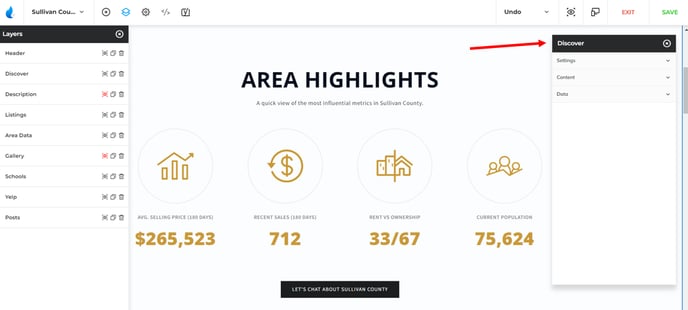
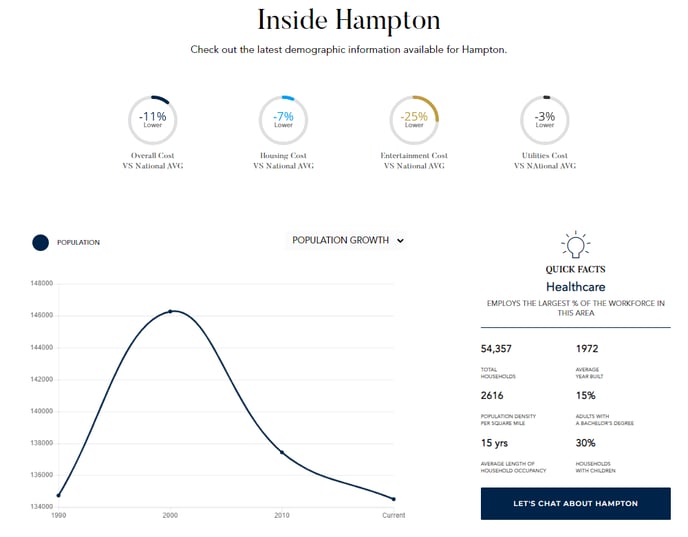
In this section you can customize the highlighted data points such as population, average sell price, etc. (up to 4 data points can be added to this section)
Example:
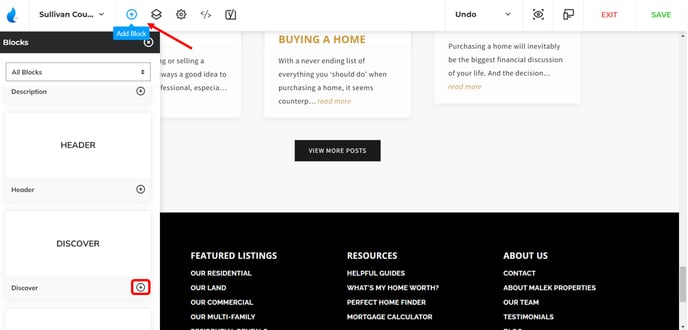
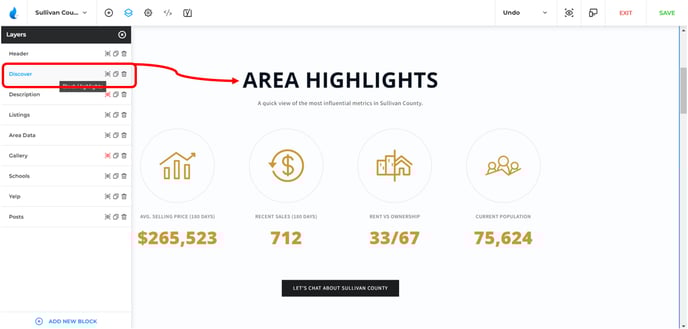
Once you are inside the Editor, navigate to the Discover section.
From there, collapse the Data tab, and set "Use Custom Data" to YES.
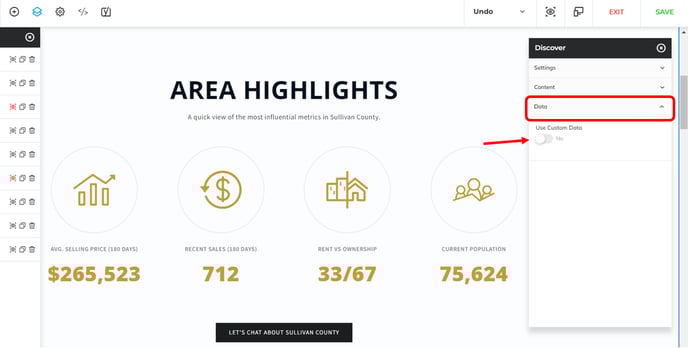
Once you do that, you will see further fields open up, where you can start manually adding the specific data points you want to highlight/override the existing.
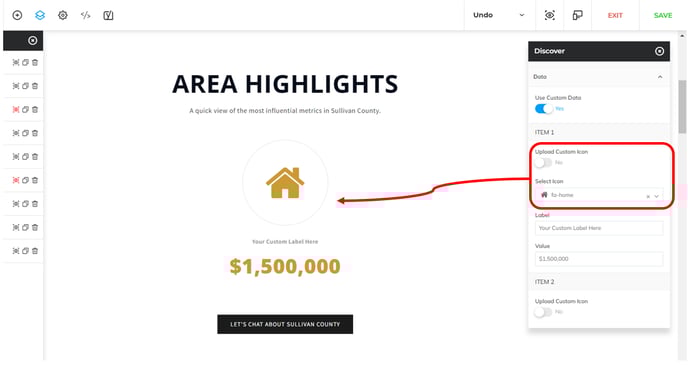
There are a few fields you can work with for each highlight, one of them is the icon. You can upload an icon (if you want to use a specific one), or select one from our collection.
The rest of the fields are filled out on your will. See the example below:
-
Icon: Selected home icon from the collection
-
Label: Your Custom Label Here
-
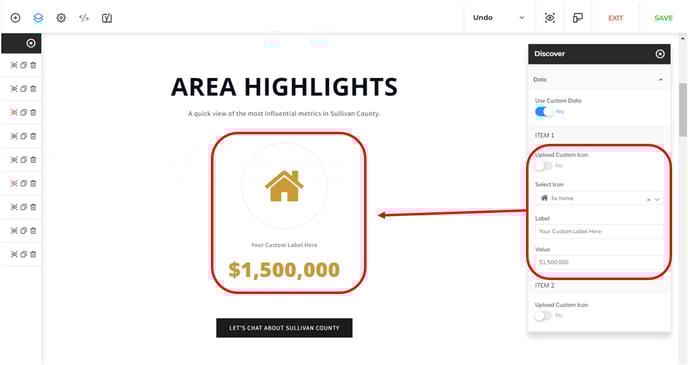
Value: 1,500,000
Note: the highlights will automatically adjust their alignment, based on the number of highlights you have.
Area Data - Demographic Information
In this section you can override specific data points such as population growth, household income, etc.
Example:
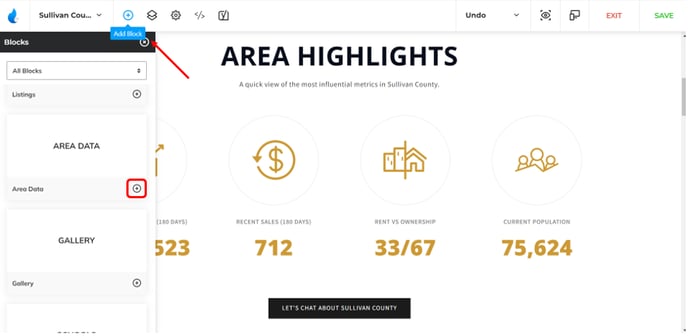
Navigate to Add A Block, select the Legacy button.
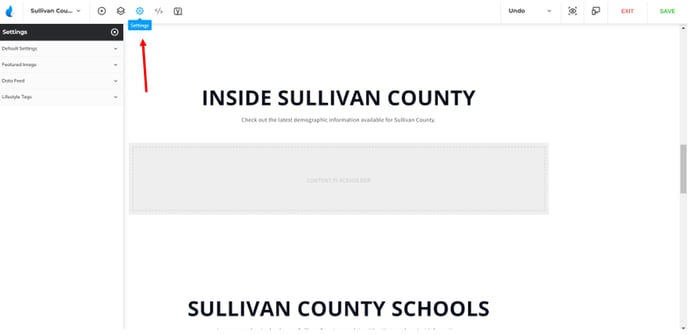
Navigate to the Settings section on top.
Collapse the Data Feed tab - here you can set which area's data should be pulled from databases - click on the Add Custom Value button.
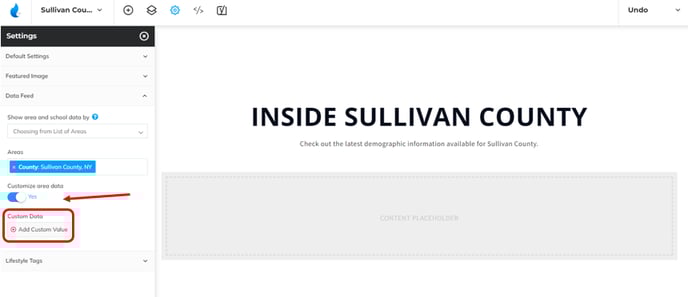
As you do that, you will see Field, and Value tabs appearing, where you can enter the desired value for specific data points. You can add, and customize as much as you need.
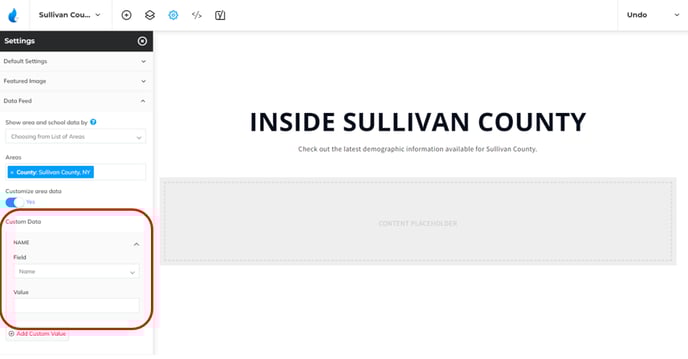
In the Field dropdown, you can select which data point you want to edit and entering the value below.
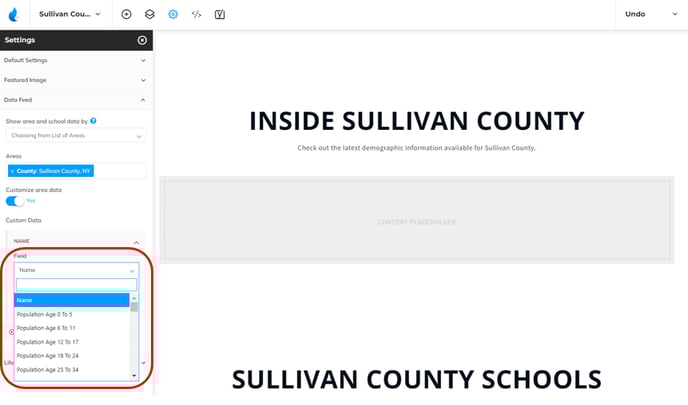
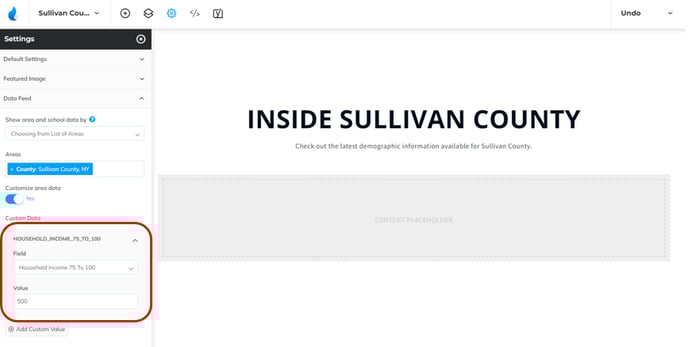
For example, select Household Income 75 to 100, and set the value to any number below.
You can also remove custom data added by clicking the small X that appears if you hover on the left side of the field with your mouse. Also, as mentioned before, you can add subsequent data points as many as you wish, but keep in mind that Add Custom Data button will always appear below the last added field.
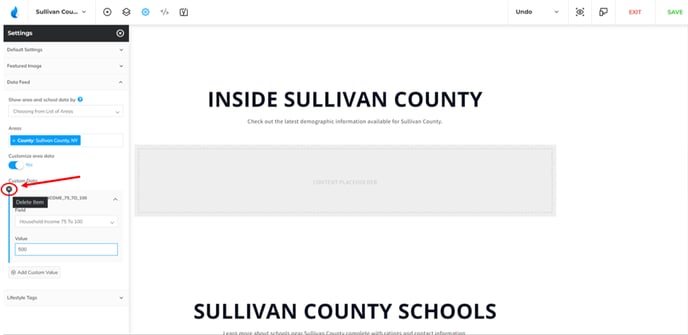
Oh, and don't forget to save the changes you made :)
Further Education:
Learn how to Add/Edit Areas, Neighborhoods, Developments, and also understand how to use all the features of the Neighborhood Guides:
Did this answer your question?😞😐😃